AC interconnectors carry a published operating margin of 25 to 50 MW. Regulation FCAS could shrink it without a new market
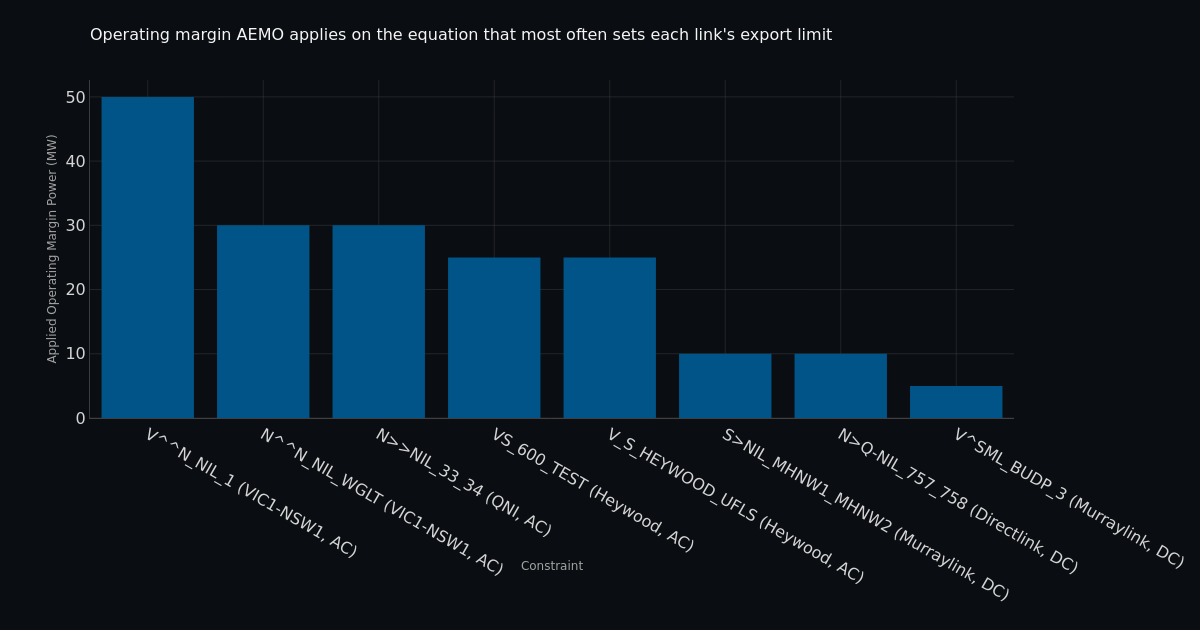
AEMO holds every interconnector below its limit by an Operating Margin: Modelling Approximation + Dispatch Error + Measurement Error. It writes the number into the constraint equation as a named constant, and NEMWeb publishes the equation, so nobody has to estimate it.
On the equations that most often set each link's own limit it is 25 MW on Heywood, 30 to 50 MW on VIC1-NSW1 and QNI, and 5 to 10 MW on Murraylink and Directlink. Applied values move in 5 MW steps: across 5,165 constraints and 35,075 constraint versions effective since 1 January 2024, 99.85% are exact multiples of 5 MW.
Dispatch error is one of the three components, and it is larger on the AC links because nothing controls their flow between dispatch intervals. Sampled once per five-minute interval, Heywood's median deviation from target is 21.4 MW. Murraylink, which has a flow controller, runs 0.2 MW. Examining the 4s data, both would be higher.
The control that would close that gap can be bought today. Regulation FCAS is already defined as following an AGC signal, and AGC already balances several objectives at once. An interchange term can be added to what it solves without changing the product, the plant or the settlement.
One 5 MW step of margin is worth $1.19m a year on Heywood, $0.81m on VIC1-NSW1 and $0.73m on QNI.
Chart: Operating margin AEMO applies on the equation that most often sets each link's export limit
Operating margins on constraint equations
Constraint equations are published as a sequence of right-hand-side terms. The Vic-to-NSW voltage stability equation V::N_NIL_V2 ends with three constants:
Intercept              970.6
Confidence Interval   -129
Operating Margin       -50
The equations that set each link's export limit most often, over the year to 31 July 2026:
| Constraint | Link | At-limit intervals | Operating margin |
|---|---|---|---|
V^^N_NIL_1 | VIC1-NSW1 | 8,979 | 50 MW |
N^^N_NIL_WGLT | VIC1-NSW1 | 4,044 | 30 MW |
VS_600_TEST | V-SA (Heywood) | 5,692 | 25 MW |
V_S_HEYWOOD_UFLS | V-SA (Heywood) | 4,146 | 25 MW |
N>>NIL_33_34 | NSW1-QLD1 (QNI) | 1,934 | 30 MW |
S>NIL_MHNW1_MHNW2 | V-S-MNSP1 (Murraylink) | 21,044 | 10 MW |
AEMO's Interconnector Capabilities (September 2025) names the same equations. Murraylink's transfers into South Australia are "mainly limited by: Thermal overloads on: Monash to North West Bend #2 132kV line (S>NIL_MHNW1_MHNW2)", and VS_600_TEST is the Heywood inter-network testing limit that document describes.
A published margin covers 98.6% of VIC1-NSW1's at-limit intervals and 94.1% of Murraylink's, but only 67.3% of Heywood's and 36.8% of QNI's. The rest are set by equations carrying no named margin term. When a Victorian stability equation binds Murraylink rather than one of Murraylink's own, Murraylink inherits that equation's 50 MW.
Why AC flow needs the control
Murraylink and Heywood both connect Victoria to South Australia and face the same regional imbalance. Heywood's median deviation from target is 21.4 MW, Murraylink's 0.2 MW.
Every deviation figure in this article, including the correlation and the sizing below, is METEREDMWFLOW minus the previous target: one instantaneous reading per five-minute interval, sampling roughly one of the 75 four-second measurements inside it. Four-second flow would put all of them higher.
Regulation FCAS as procured today cannot shrink the interconnector deviation. Under system-normal conditions regulation is bought for two areas, the mainland as one synchronous AGC area and Tasmania. Over the study year the raise-regulation price was identical across the four mainland regions in 92.6% of intervals, differing in the other 7.4% when a regional requirement was invoked.
The mainland has one frequency, so regulation anywhere corrects it equally. Regulation is blind to location for frequency and specific to location for flow: a Queensland unit responding to a Victorian deviation corrects frequency and creates inter-regional flow doing it.
Regional deviations also cancel. Over May to July 2026 the correlation between VIC1-NSW1 and Heywood deviation was -0.38. If South Australia is long 100 MW while NSW is short 100 MW, mainland frequency is correct, AGC does nothing, and 100 MW of unscheduled flow appears on interconnectors. More regulation bought under today's arrangements sits idle through exactly those intervals.
ESOPP_08 names regulation as a cause of dispatch error rather than a cure for it:
Errors may arise due to generators not following dispatch instructions or being required to move away from the target value due to Frequency Control Ancillary Service (FCAS) requirements, particularly if the generator is providing raise or lower regulation service.
Any proposal that inverts that carries the burden of proof.
A second control loop, not a second market
Leave the existing mainland-wide regulation requirement alone; it goes on controlling frequency. Procure a further quantity in matched regional pairs, one region either side of the link being regulated, and run a controller that watches flow error and issues a balanced command against it. Flow 10 MW too high into South Australia means 10 MW of raise in South Australia and 10 MW of lower in Victoria. Sum that into the AGC output.
The pair is zero net energy by construction, so mainland frequency does not move and the frequency loop does not see it. Frequency control acts on total mainland injection; flow control acts on how that injection is distributed between regions.
The Market ancillary service specification, ESOPP_12 v8.1, defines regulation as a response to a signal rather than as a correction of frequency, and accepts that AGC is solving several problems at once:
Because AGC must balance various objectives simultaneously (including frequency control, load following, time error correction and dispatch ramping), occasionally, the direction of the Contingency FCAS or PFR response calculated by the FCAS Provider could be the opposite to the AGC control signal.
AEMO could compose one AGC setpoint and send it, and the facility follows it as it does today. The capability is bought and paid for as regulation FCAS. What changes is the requirement, and AEMO already invokes regional regulation requirements in 7.4% of intervals.
The commercially important step is a constraint NEMDE prices each interval:
V-SA export flow - k x (SA regulation enabled) <= Limit
Let k be the exchange rate: megawatts of interconnector flow moved per balanced pair procured. A balanced pair is 1 MW of raise in one region and 1 MW of lower in the other, dispatched together, costing RAISEREGRRP in the region raising plus LOWERREGRRP in the region lowering.
A pair moves the boundary by 1 MW, not 2 MW. Raising South Australian generation by 1 MW with load unchanged means South Australia imports 1 MW less, so Heywood flow falls by 1 MW. The Victorian lower makes room for that without changing total mainland generation. Do the raise alone and the mainland regulation loop takes the megawatt back wherever regulation happens to be enabled.
Sizing each interconnector's pair on its own overbuys, because a region sits on more than one boundary and its two commands partly cancel.
Chart: Regional regulation to buy: sized per link against sized across boundaries (p95)
At the 95th percentile Victoria needs ~122 MW of capability sized across both its boundaries against ~183 MW sized per link, and NSW ~140 MW against ~230 MW. Both are five-minute figures, so both size the capability low.
The fleet to supply it is idle. Over May to July 2026 the mainland's 68 battery DUIDs carried 3,039 MW of raise-regulation availability on average and sold 148 MW of it. That availability is trapezium-adjusted for each unit's actual energy dispatch, so it is a lower bound on what re-dispatch could offer.
Line-level flow control on this corridor is already being built. VNI Minor, commissioned in March 2023, included "installation of modular power flow controllers on the Stockdill to Upper Tumut (1) and Ravine to Yass (2) 330 kV lines". Those steer flow between parallel lines. What is proposed here steers it between regions, using plant already in the market.
What is actually addressable
The confidence interval sitting beside the operating margin is a separate allowance with a separate owner. A limit equation is a fit to offline stability studies, and the confidence level is what holds the fitted equation below the true study limit for at least 95% of cases. It covers error in the equation, not error in dispatch. It is set by the network service provider, and no amount of flow control moves it. On VIC1-NSW1's limit-setting equations it runs 110 to 159 MW, against a 50 MW operating margin. ESOPP_08 s7.1.3 adds the two rather than combining them in quadrature, so removing one leaves the other where it is.
Inside the operating margin, only some components move:
| Component | Moves with tighter flow control |
|---|---|
| Dispatch error | Yes |
| Modelling approximation | Partly, for the interconnector term |
| Measurement error | No |
Modelling approximation moves partly because of how ESOPP_08 defines it: "When determining the constraint limit to apply for the five-minute dispatch interval NEMDE assumes the RHS line flow, generator output and load values remain constant during the interval. However, it is likely that at least some of these values will vary over the 5 minutes." A controller holding interconnector flow to target reduces that variation for the interconnector term. It does nothing for the others.
AEMO does not publish the split between the three, so the ceiling on this proposal is the operating margin itself. On Heywood that is 25 MW against a 600 MW testing limit, the operative limit AEMO's Interconnector Capabilities gives for Victoria to South Australia. This is a margin trade, not a capacity upgrade.
The economics
Separation is directional: the gain from moving one more MW in the constrained direction, negative where relief has no value. The trade pays when k times that beats the regulation price.
| Link | Congested intervals | Mean separation when positive | Mean regulation pair price | Break-even k |
|---|---|---|---|---|
| V-SA (Heywood) | 43,819 | $80.70/MWh | $7.23/MW/h | 0.090 |
| VIC1-NSW1 | 42,715 | $54.83/MWh | $7.35/MW/h | 0.134 |
| NSW1-QLD1 (QNI) | 44,922 | $46.74/MWh | $8.00/MW/h | 0.171 |
A balanced pair needs to move only 0.09 to 0.17 MW of flow to cover its cost.
The unit that matters is one 5 MW step, because that is the increment AEMO's equations move in.
Chart: Annual value of one 5 MW step of the operating margin, k = 1.0
Value of that step over the year, net of the regulation bought to deliver it:
| Link | k = 1.0 | k = 0.5 | k = 1.0, thermal-limited intervals only |
|---|---|---|---|
| V-SA (Heywood) | $1.19m | $1.12m | $146.5k |
| VIC1-NSW1 | $0.81m | $0.71m | $83.4k |
| NSW1-QLD1 (QNI) | $0.73m | $0.64m | $304.8k |
Halving k costs little, because a lower exchange rate means buying more pairs at a price an order of magnitude below the separation they capture. What sets the answer is how often the link is congested, not how efficiently regulation converts into flow.
The last column is the floor: what the step is worth if every stability margin stays where it is and only thermal limits move. QNI leads it because thermal limits set its export limit in 29.9% of at-limit intervals, against 13.2% on VIC1-NSW1 and 3.8% on Heywood.
k = 1.0 is the ceiling the topology allows. At regional level the NEM is a tree, so power moved into a neighbouring region has no parallel path to loop around. A balanced pair therefore moves a full megawatt across the boundary in the steady state. Realised k sits below that, mostly because of the delay between measuring an interconnector's flow deviation and the paired units acting on the command that follows.
Note: collapse of price separation as capability is added is not modelled.
The case for investigating it
The break-even ratio is 0.09 to 0.17, and the trade clears it even on the thermal-limited subset of constraints alone. Perhaps it is not as large a system change as it might seem: a regional regulation requirement plus an interchange term in AGC, using the FCAS product, the plant capability and the settlement arrangements as they are today. That matters because the AEMC's September 2024 transmission access report recommended against the hybrid model that included a congestion relief market, on the basis that "it was not clear that the model's benefits would outweigh its implementation costs and complexity".
Method, sources and caveats
Window. 1 August 2025 to 31 July 2026 NEM time, INTERVENTION = 0, 105,119 five-minute intervals per interconnector after the one-interval lag. Deviation, boundary-sizing and battery figures use 1 May to 31 July 2026 (26,495 intervals) to stay inside the query scan cap. The 5 MW-step distribution covers constraint versions effective from 1 January 2024. No coverage_warning was returned on any query.
Tables.
consolidated.gcrhs__gcrhsandconsolidated.gcrhs__gcrhs__null: AEMO's constraint right-hand-side terms, including the operating margin.consolidated.dispatch__dispatch__interconnectorres: targets, metered flow, limits, limit-setting constraint id.consolidated.dispatch__dispatch__price: regional and FCAS prices.consolidated.dispatch__dispatch__unit_solution: regulation availability and enablement.semantic.constraint_description: constraint category and description.semantic.duid_fuel_type,semantic.duid_region,semantic.duid_registered_capacity: the battery fleet.
Definitions. Deviation is METEREDMWFLOW(t) - MWFLOW(t-1). Metered flow is a start-of-interval reading, so it reflects the previous target. At-limit means the target was positive and within 1 MW of EXPORTLIMIT. Congested means flow within 1 MW of the applicable limit in either direction. Regulation cost is RAISEREGRRP in the sending region plus LOWERREGRRP in the receiving region, scaled by 5/60 alongside separation so the units agree. Availability is RAISEREGACTUALAVAILABILITY, trapezium-adjusted for actual energy dispatch. Limit category is LIMITTYPE via semantic.constraint_description. All percentiles use quantileExact.
What is measured and what is not. The operating margins are AEMO's published values, read from its own constraint equations. The flow deviations are measured from dispatch outcomes at five-minute resolution, which understates them. The exchange rate k is not measured. Topology sets its ceiling at 1.0, but likely lower due to communication delays. No counterfactual NEMDE run was performed, so the collapse of price separation as capability is added is not modelled and the annual totals overstate benefit. Per-link figures cannot be summed: Victorian regulation serves two boundaries, and so does NSW's. The coordination sizing is a calculation on measured deviations, not a controller simulation. The published operating margin covers modelling approximation, dispatch error and measurement error together. AEMO does not publish the split, so the share this proposal could recover is bounded above by the margin and not otherwise known.
Documents. Quotations are from AEMO, Confidence Levels, Offsets & Operating Margins - Policy, ESOPP_08 v3, 6 July 2010, read in full, which describes several of its provisions as proposals. AEMO's Limits Advice Guidelines (February 2025) confirms it is still the operative reference. The AGC quotation is from AEMO, Market ancillary service specification, ESOPP_12 v8.1, effective 9 October 2023. The constraint-attribution check, the VNI Minor power flow controllers and the Heywood 600 MW testing limit are from AEMO, Interconnector Capabilities, 25 September 2025, read in full. The AEMC quotation is from its media release on the September 2024 transmission access final report.
Figures verified 12 August 2026 through the NEM Explorer MCP server.