Does P5MIN beat persistence for regulation FCAS prices?
The price of regulation FCAS changes every five minutes. AEMO publishes a forecast for it — P5MIN — but is it actually worth using, or does it perform the same as just assuming nothing changes? We ran a full year of dispatch data to find out.
What P5MIN is, and why the next interval matters
P5MIN is AEMO's five-minute pre-dispatch process. It reruns every five minutes and produces a forecast for each of the next twelve five-minute intervals — a rolling hour-ahead view of the market, including RAISEREG and LOWERREG.
Its earliest forecast — for the interval immediately after the current one — publishes about one to two minutes into the current interval, before that next interval is dispatched. In principle that's exactly the number a rebid into the next interval could be built on: a look-ahead estimate that arrives in time to act on.
Why does next-interval accuracy matter more than any other horizon? Because it's the only forecast you can still do something about. A forecast for 45 minutes out is useful for planning. A forecast for 5 minutes out is the number your bid (or rebid) is for.
The bar it has to clear: persistence
Before crediting P5MIN with anything, we need a baseline for what happens if you ignore it completely. The simplest possible forecast — persistence — just assumes the price next interval will be the same as the price this interval. If P5MIN can't beat that, it isn't earning its complexity.
Measuring it
We compared P5MIN's forecast for RAISEREG and LOWERREG against persistence at every horizon from 5 to 55 minutes ahead, over the full year from July 2025 to June 2026 — about 105,120 dispatch intervals per region per horizon. Intervention-priced intervals excluded.
Skill = 1 − MAE(P5MIN) ÷ MAE(persistence). Positive means P5MIN's forecast lands closer to the actual price than persistence's guess; negative means the naive guess wins. Mainland regions are pooled below. Tasmania is shown on its own as its prices diverge from mainland regulation prices.
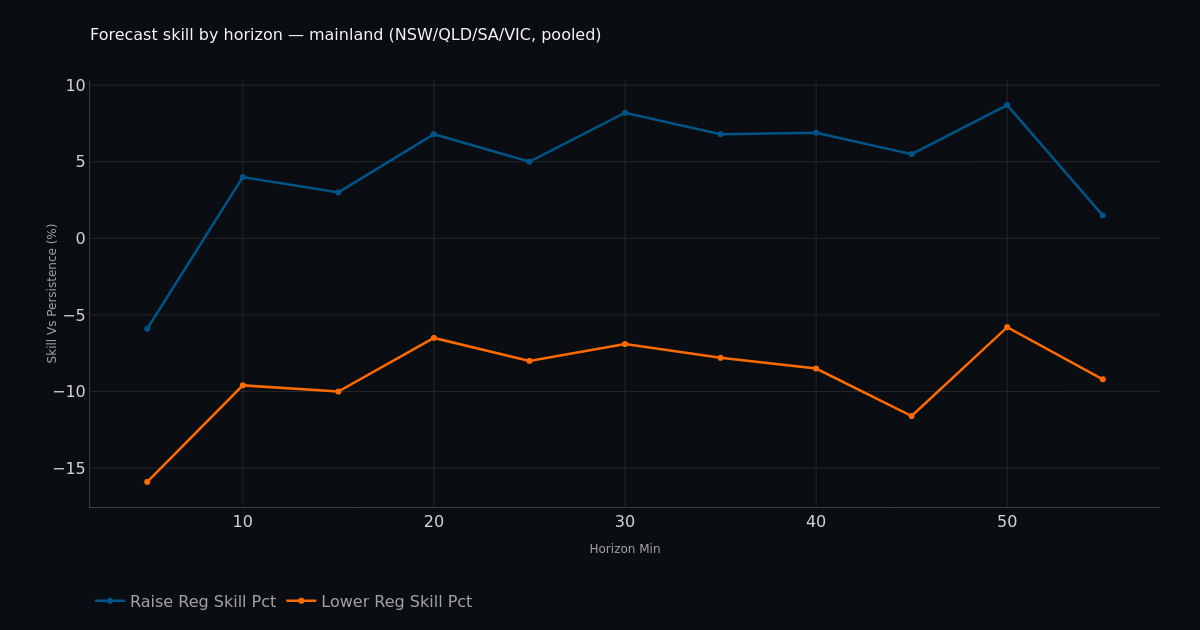
Chart: Forecast skill by horizon — mainland (NSW/QLD/SA/VIC, pooled)
The result changes with how far ahead you look. At the 5-minute horizon (the one that actually matters for bidding into the next interval) P5MIN gives you nothing on the mainland: persistence beats it for both raise (−6%) and lower (−16%) regulation. A modest edge for raise reg shows up from about 10 minutes out (roughly +4% to +9%), but lower reg never catches up — it's negative at every horizon we measured.
Tasmania, cut off electrically from the mainland (in an FCAS sense), behaves completely differently.
Chart: Forecast skill by horizon — Tasmania (islanded)
In Tasmania, P5MIN is genuinely useful at short horizons — best around 15 minutes out, beating persistence by ~30%.
Is it usable for next-interval bidding?
P5MIN's 5-minute-ahead forecast publishes with enough lead time to inform a rebid into the next interval before that interval is dispatched.
But at the 5-minute horizon, P5MIN gives no advantage over the last cleared regulation price — for immediate next-interval bidding on the mainland, the forecast isn't adding anything persistence doesn't already provide for free. It starts pulling ahead of persistence from about 10 minutes out, and even then only modestly, and only for raise. The one place the next-interval forecast is genuinely worth using today is Tasmania.
| Horizon | Mainland raise | Mainland lower | TAS raise | TAS lower |
|---|---|---|---|---|
| 5 min | −5.9% | −15.9% | +21.9% | +13.6% |
| 10 min | +4.0% | −9.6% | +24.9% | +16.8% |
| 15 min | +3.0% | −10.0% | +29.3% | +32.5% |
| 20 min | +6.8% | −6.5% | +15.7% | +17.4% |
| 25 min | +5.0% | −8.0% | +11.5% | +4.0% |
| 30 min | +8.2% | −6.9% | −0.4% | −9.3% |
| 35 min | +6.8% | −7.8% | −8.9% | −22.5% |
| 40 min | +6.9% | −8.5% | −18.9% | −34.7% |
| 45 min | +5.5% | −11.6% | −41.9% | −60.2% |
| 50 min | +8.7% | −5.8% | −69.2% | −72.2% |
| 55 min | +1.5% | −9.2% | −84.1% | −59.7% |
Positive = P5MIN more accurate than persistence.
Caveats: skill is a ratio of average forecast error, not the dollar value of a bidding decision. Mainland regions are pooled because NEM-wide co-optimisation keeps them within a percentage point of each other. Intervention-priced intervals are excluded from both the forecast and the actual side.
How big is that in dollar terms?
Skill is a ratio, so a percentage alone can hide how the underlying error is behaving. Here's the same mainland comparison as raw mean absolute error (MAE, $/MWh) for the first three horizons. Each persistence figure is computed from the actual price at an earlier interval, not from the interval it's being scored against, so it's never zero:
| Horizon | P5MIN MAE (raise) | Persistence MAE (raise) | P5MIN MAE (lower) | Persistence MAE (lower) |
|---|---|---|---|---|
| 5 min | $2.97 | $2.80 | $1.93 | $1.66 |
| 10 min | $2.98 | $3.11 | $1.97 | $1.79 |
| 15 min | $3.14 | $3.24 | $2.04 | $1.85 |
Same year, same mainland pooling as above (n ≈ 420,000 dispatch intervals per horizon).
Want to check a different FCAS service, region, or year? Ask NEM Explorer directly — it queries the same warehouse live.