Wind and solar restarts, not shutdowns, are what raise regulation pays for
Mainland wind and solar were switched off and back on 79,361 times in the twelve months to June 2026. Two thirds of the restarts came out of a negative regional price.
The restart is where the error is. In the interval a unit comes back, it finishes 7.11 MW below its dispatch target on average, against 0.38 MW in an ordinary running interval. Holding fleet output between 6 and 8 GW, raise regulation dispatch runs at 79.0 MW when nothing is restarting and 140.4 MW when the fleet's restart deficit passes 150 MW. Lower regulation runs the other way, 39.3 MW down to 20.6 MW.
Dispatch aims every one of those restart ramps from a starting point recorded as zero. Across 956,145 unit-intervals where a mainland wind or solar unit sat at a zero target with forecast resource available, 67.6% report an initial MW of exactly 0.000000. Twenty-four report a number below zero, none of them beyond −0.4239 MW.
This follows the earlier report on the raise-over-lower regulation asymmetry, which found the mainland dispatching about twice as much raise regulation as lower and traced part of it to telemetry censored at zero. Those figures reproduce here on the same window and the same source: 78.7 MW of raise regulation dispatched against 36.9 MW of lower, a ratio of 2.13.
Wind and solar stop at zero
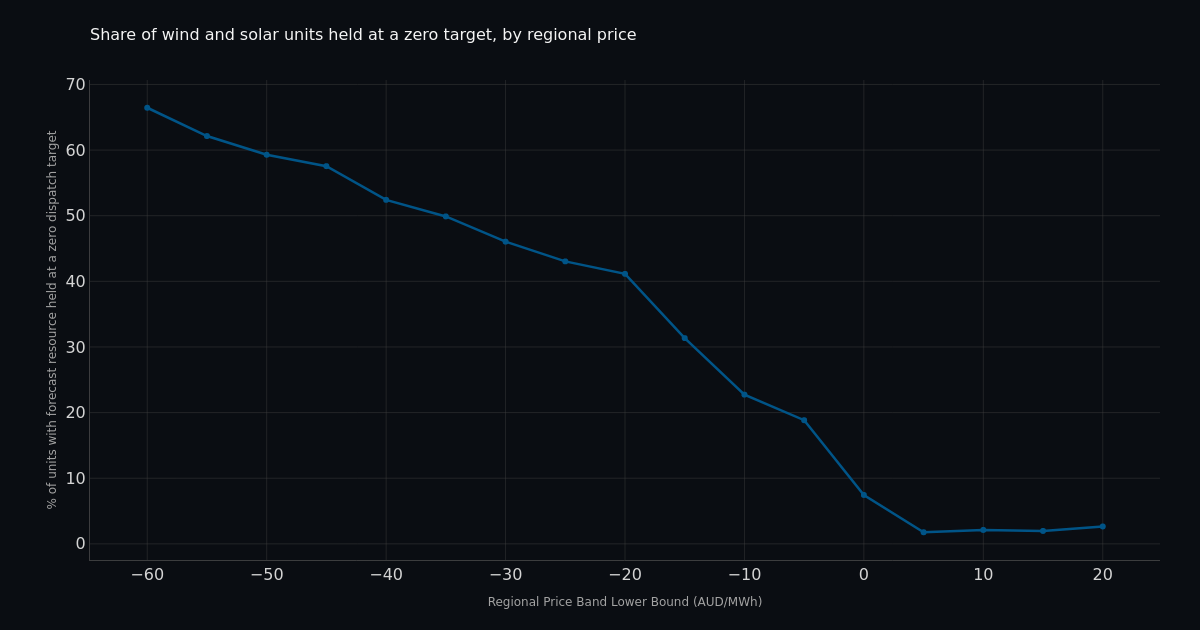
With the regional price between $5 and $10/MWh, 1.77% of mainland wind and solar units with forecast resource available sit at a zero dispatch target. Every price band above $20/MWh holds between 0.9% and 2.7%. In the five dollars above zero it is 7.45%, and in the five dollars below, 18.84%. From there the response is graded: 22.7% between −$10 and −$5, 41.1% between −$20 and −$15, 52.4% between −$40 and −$35, 70.0% between −$100 and −$60, and 80.5% between −$300 and −$100.
Chart: Share of wind and solar units held at a zero target, by regional price
The step change is at zero, and the certificate market explains why it sits there. The Clean Energy Regulator's Quarterly Carbon Market Report March quarter 2026 records that "the LGC spot price declined through Q1 2026, falling from $6.25 at the start of the quarter to $2.90 by the quarter end" and "sat at $2.40 on 15 May 2026", down "more than 90%" since the start of Q4 2024. CORE Markets quoted A$7.75 at the close of 20 August 2026. A certificate worth two to eight dollars buys a farm almost no room below zero. The price at which running stops paying and the price at which the market turns negative are now nearly the same price.
The gradient below zero is offtake structure rather than physics. Some of the fleet keeps running to −$60 and beyond; the contracts that make that rational are not in the dispatch record and are not measured here.
The fleet crosses that line eighty thousand times a year
Restarts and shutdowns are almost exactly balanced over the year: 79,361 against 78,748. They are seasonal, peaking at 11,475 restarts in December 2025 and falling to 2,558 in June 2026, and they follow the negative-price season rather than the calendar. Of the December restarts, 7,688 came out of a negative price; of the June ones, 1,191.
Chart: Wind and solar restarts per month, mainland NEM
Mean parked capacity moves with them, from 2,629 MW across December 2025 to 363 MW across June 2026.
The transition is where the fleet misses
An ordinary running interval is accurate. Across 9.7 million of them the mean delivery error is −0.38 MW.
A restart interval misses by 7.11 MW, a factor of 18.7. The median restart misses by 1.75 MW and one in twenty misses by more than 45.7 MW, so the mean is carried by a tail of large units coming back at once. A shutdown interval overshoots by 4.30 MW, median 1.00 MW. Restart deficits are 65% larger than shutdown surpluses and the two are close to equal in number, so the transitions leave a standing deficit.
Chart: Mean delivery error against dispatch target, by transition type
The obvious explanation is that dispatch asked for a ramp the plant could not physically deliver. It did not. All 79,361 restart targets sat inside the unit's own declared ramp-up allowance, and by a wide margin. The mean requested ramp was 36.57 MW against a mean declared allowance of 7,245 MW per five minutes, and the fifth percentile of that allowance is still 1,800 MW. The unit achieved 29.46 MW of the 36.57. Whatever holds the restart back, the unit did not tell dispatch about it through the ramp rate.
Price makes the deficit worse. A restart out of a negative price misses by 7.92 MW; a restart from a price at or above zero misses by 5.66 MW.
Raise regulation tracks the restart deficit
Sum the delivery errors of every unit restarting in an interval and the relationship with regulation dispatch is monotonic, in both services, in all four fleet-output bands.
Chart: Regulation dispatched against the fleet's restart deficit, output held at 6-8 GW
Take mainland semi-scheduled output between 6 and 8 GW. Raise regulation dispatch runs 79.0 MW when the interval's restart deficit is under 10 MW. It runs 92.4, 103.5 and 140.4 MW across deficit bands of 10 to 50, 50 to 150 and above 150 MW. Lower regulation over those four bands runs 39.3, 38.4, 34.7 and 20.6 MW. Between 8 and 10 GW of output the raise series is 93.6, 107.8, 123.3 and 144.0 MW. The two bands dispatch 0.31 and 0.25 MW of raise regulation for each MW of restart deficit.
The shutdown is the mirror image and the cheap half. Intervals in which at least 300 MW of capacity moves into the parked state carry raise regulation within 11% of a stable interval, and lower regulation 15% to 50% above it. The system is long at that moment, and lower regulation is the service that is plentiful and cheap. The restart happens when the system is tightening again, and it is covered by the service that is neither.
Dispatch aims the restart from a number it cannot record
A semi-scheduled unit describes itself to dispatch through three quantities, and all three are bounded below at zero. Across the 956,145 parked unit-intervals, AVAILABILITY is never negative, UIGF is never negative, and INITIALMW is negative 24 times. INITIALMW reads exactly 0.000000 in 646,662 of them and its mean is +0.3564 MW.
Chart: What a parked wind or solar unit reports as its starting MW
A wind farm holding at a zero target with the wind blowing is not at zero. It is importing: transformer no-load losses, pitch and yaw drives, harmonic filters, site auxiliaries. The size of that import is the quantity the earlier report bounded from station ratings, and it cannot be measured from the public record for the reason this paragraph describes. The June 2026 telemetry says the same thing directly. Of 15,287 parked unit-intervals at a negative price that month, across 93 separate units, 11,529 report SCADA of exactly 0.000000 and none report a negative number.
So the reference trajectory for every restart begins a house load too high. That is a small share of the 7.11 MW. Most of the deficit is the plant taking longer to come back than the interval allows, and a negative forecast does not fix that on its own. What the zero bound removes is the market's ability to see either quantity. A unit cannot state that it is importing, and it cannot state a recovery path that starts below zero. Dispatch has no basis on which to schedule the restart differently.
What a negative forecast would change
Today a TOTALCLEARED of 0 with an AVAILABILITY of 0 describes a plant idling on house load and a plant that is genuinely absent identically, and the demand calculation absorbs the difference. A signed forecast separates them.
The restart gets a trajectory. A unit that could publish a forecast beginning below zero and rising would give dispatch a starting point and a shape. What it has instead is a linear ramp from an assumed zero to a target the fleet misses by 7.11 MW, 79,361 times a year.
And the cost becomes attributable. Regulation is recovered from causers. A deficit that cannot be represented in the input data cannot be assigned to the unit that produced it, so it is socialised through raise regulation instead.
None of that requires a new market. It requires the forecast and telemetry fields for semi-scheduled units to carry a sign.
Method, sources and caveats
Window: 1 July 2025 to 30 June 2026, NEM time (Australia/Brisbane, UTC+10), 5-minute dispatch resolution, INTERVENTION = 0 throughout. Universe: the 236 mainland (NSW1, QLD1, SA1, VIC1) semi-scheduled wind and solar DUIDs registered across the window, totalling 29,412 MW. Monthly transition counts extend to July 2026 and the SCADA figures are June 2026. The warehouse returned no coverage warnings over any of these ranges.
Tables: consolidated.dispatch__dispatch__unit_solution (TOTALCLEARED, INITIALMW, UIGF, AVAILABILITY, RAMPUPRATE), consolidated.dispatch__dispatch__unit_scada (SCADAVALUE), consolidated.dispatch__dispatch__price (RRP), and consolidated.fpp__fpp__fpp_usage (REGULATION_MW, USED_MW), with semantic.duid_fuel_type, duid_region and duid_registered_capacity for the fleet definition.
Definitions. A unit is parked when UIGF > 5 MW and TOTALCLEARED < 0.5 MW. A restart interval is one where the previous target was below 0.5 MW and this one is above 5 MW; a shutdown interval is the reverse. Delivery error is INITIALMW(t+1) - TOTALCLEARED(t). SCADAVALUE(t) and INITIALMW(t) are the same telemetered reading, with a mean absolute difference of exactly 0.0000 over the 381,795 unit-intervals tested. Both are therefore the MW at the start of the interval stamped t, so the end-of-interval reading has to be taken from the following row. Regulation dispatched is AEMO's published USED_MW from the FPP usage table, on the mainland regulation constraints (F_MAIN% and F_I+%); where two of them apply in the same interval, the one carrying more enabled MW is used. This is the same quantity and the same filter the earlier report used. Enabled regulation over this window averages 223.6 MW raise and 220.1 MW lower.
What this does not establish. Regulation dispatch and restart deficits are measured in the same interval, so the association is a coincidence in time and not a causal estimate; no counterfactual dispatch was run. Fleet output is controlled for in bands, but renewable volatility, demand forecast error and interconnector deviation are not, and all three rise with the conditions that produce negative prices. The parked definition does not separate a unit withheld on price from one held down by a network constraint. The price gradient in the first section shows the increment below zero is price-driven; the residue parked at prices above $5 is not. The size of station auxiliary load is not measured here and cannot be measured from the public record. And the shortfall below zero on a semi-scheduled forecast is one contributor to the raise-over-lower asymmetry, not the whole of it.
Queried using NEM Explorer. Source data: AEMO MMSDM dispatch, unit SCADA and FPP datasets. LGC prices: Clean Energy Regulator, Quarterly Carbon Market Report March quarter 2026; CORE Markets market prices page, retrieved 21 August 2026.