The NEM burns twice as much raise regulation as lower — and ~100 MW of the answer is missing from the data
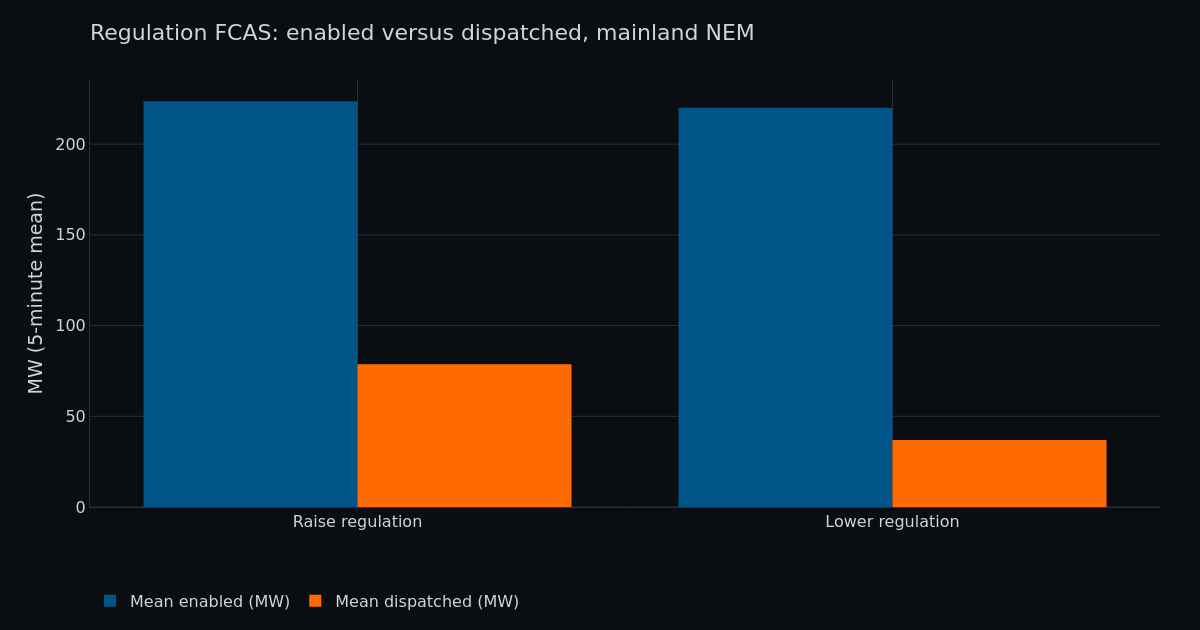
AEMO procures raise and lower regulation in near-identical volumes: 223.6 MW and 220.1 MW respectively, averaged across the mainland over the twelve months to June 2026. Dispatch is not symmetric. AGC calls on raise regulation 2.1 times as heavily as lower. RAISEREG has cleared at two to four times the LOWERREG price throughout.
This report decomposes that asymmetry using AEMO dispatch, SCADA and FPP data at 5-minute resolution, mainland NEM, July 2025 to June 2026. It concludes with a quantity that is material to the result and that no public dataset can measure.
1. Procurement is symmetric; dispatch is not
Utilisation of enabled capacity is 35.7% for raise and 17.1% for lower. The mean dispatch gap between the two services is 41.8 MW. That gap is the quantity this report seeks to explain.
Chart: Regulation FCAS: enabled versus dispatched
2. Dispatch follows the solar cycle
Raise dispatch peaks at 126 MW at 16:00, coincident with the solar drop-off and the onset of the evening demand ramp. Lower dispatch peaks at 52 MW at 07:00, on the morning solar ramp, and reaches its minimum at the hour raise reaches its maximum.
Raise exceeds lower in all 24 hours, including overnight periods with no solar generation on the system.
Chart: Mean regulation dispatched by hour of day
3. The proximate cause is a net-load deficit
Regulation dispatch scales with the direction of the net-load error against the dispatch trajectory. Two decompositions demonstrate this.
Against the 5-minute mainland demand ramp, the relationship is monotonic. At a ramp-up exceeding 300 MW per interval, dispatch is 135.0 MW raise against 25.2 MW lower.
Against aggregate semi-scheduled delivery error, the relationship is stronger. A wind and solar shortfall exceeding 150 MW against dispatch target coincides with 147.6 MW raise against 18.4 MW lower. A surplus exceeding 150 MW is the only condition in the dataset under which lower dispatch exceeds raise, at 44.0 MW raise against 92.2 MW lower.
Neither result is a finding in the causal sense. Raise regulation exists to correct a generation deficit against the dispatch trajectory; establishing that it deploys during generation deficits is close to definitional, and the same relationship would hold for demand forecast error, interconnector deviation, or any other source of imbalance. The substantive question is not what regulation responds to, but why deficits systematically outweigh surpluses.
Chart: Regulation dispatched versus demand ramp
4. The asymmetry originates in the shape of the semi-scheduled delivery-error distribution
Semi-scheduled units fall short of dispatch target in 55.5% of intervals. Shortfall is barely more frequent than surplus, so frequency is not the source of a 2:1 dispatch asymmetry. Magnitude is.
The aggregate delivery-error distribution is materially left-skewed, with a skewness coefficient of −1.07 and a mean of −28.1 MW against a median of −10.3 MW. The lower tail is approximately twice the depth of the upper tail: the 1st percentile is −411 MW, the 99th is +213 MW.
This is a structural property of the dispatch framework. A semi-scheduled target is bounded above by the availability forecast, but the unit's actual output is not: output can exceed target whenever the resource beats forecast, and is held down only when a semi-dispatch cap binds. Overshoot is therefore limited only some of the time; undershoot is limited only by the weather. Shortfalls can accordingly run deeper than surpluses.
Chart: Distribution of wind and solar delivery error
5. Curtailment headroom governs the depth of the lower tail
The determinant of whether a semi-scheduled unit holds its dispatch target is the headroom it carries between that target and its availability forecast. Analysis of 1.9 million unit-intervals (October–November 2025, mainland wind and solar) establishes a monotonic relationship.
A unit dispatched at its availability forecast, with no headroom, falls more than 5% below target in 23.7% of intervals. A unit curtailed to below 40% of its availability falls more than 5% below target in 0.4% of intervals — a factor of sixty. Its 5th-percentile delivery error is zero to three significant figures.
Where headroom exists between the semi-dispatch cap and the resource, a reduction in wind or irradiance is absorbed by the headroom rather than by the target.
Chart: Headroom versus failure to hold dispatch target
6. The unit-level effect does not carry through to the system
Section 5 showed that a unit holding headroom below its availability forecast is roughly sixty times less likely to miss its dispatch target than a unit dispatched flat out. That sixty-fold improvement almost vanishes once the fleet is aggregated: at system level it is worth a factor of about 1.2.
Holding total semi-scheduled output between 6 and 10 GW, and raising the share of the fleet carrying more than 10% headroom from below 5% to above 50%, reduces mean raise dispatch only from 99.2 MW to 84.0 MW, and narrows the raise-to-lower ratio from 3.09 to 2.36.
Two effects dilute it. First, curtailment is concentrated: it falls on a small number of network- and price-constrained units, which are generally not the units experiencing the wind or cloud disturbance that regulation is called on to cover. Second, the intervals in which a large share of the fleet is curtailed are also the intervals of highest semi-scheduled output and highest resource volatility, so the firming benefit is set against a larger underlying disturbance.
Curtailment headroom is therefore a real mechanism, but not one large enough to account for a 41.8 MW dispatch gap.
Chart: Regulation dispatched versus share of fleet carrying headroom
7. A material quantity is absent from the data by construction
Semi-scheduled units are registered as generators. Their availability forecast and dispatch target are consequently bounded below at zero. Across 20.3 million unit-intervals, the minimum recorded AVAILABILITY is 0.0 MW and the minimum recorded TOTALCLEARED is 0.0 MW. Neither takes a negative value.
The plant itself does not sit at zero when the resource is absent. Transformer no-load losses across the main transformer and unit transformers, harmonic filters, pitch and yaw drives, and site auxiliaries constitute a real import. A 300 MW wind farm at rest could draw ~1 MW.
The telemetry does not record this. The distribution of raw SCADA for mainland wind and solar contains a point mass of 732,602 unit-intervals at exactly 0.000000 MW — 39% of the month's observations, against 9 intervals below −0.5 MW. The minimum value recorded across the entire mainland fleet in June 2026 is −0.708 MW.
Chart: Raw SCADA near zero: point mass at exactly zero
The distribution is censored at the lower registration bound. Observations that would fall below zero are recorded at zero.
The censored quantity can be bounded. Mainland wind and solar comprise 236 units totalling 29,412 MW. Station auxiliary load of 0.3% to 0.5% of rating implies a fleet import of 88 to 147 MW when at rest. AEMO's SCADA reports a mean fleet import of 0.15 MW.
The censored quantity is therefore two to three times the size of the 41.8 MW dispatch gap under investigation.
Chart: Censored auxiliary load compared with the dispatch gap
A seasonal test: regulation tracks the solar cycle, not the clock
The censoring hypothesis makes a falsifiable prediction. If the zero bound on semi-scheduled forecasts and telemetry contributes to raise regulation, it must act at the moment semi-scheduled solar shuts down — and that moment moves through the year. Mainland large-scale solar falls to zero around 17:00 (NEM time) in winter and around 19:00 in summer, a shift of ninety minutes to two hours. A driver anchored to human behaviour — the evening demand ramp — does not move that way: mainland demand peaks at 18:00–18:30 in both seasons. The two candidate explanations therefore separate cleanly in the record.
They separate in favour of solar. In winter, mean raise dispatch peaks at 124 MW at 16:00, coincident with the winter solar collapse, and has already fallen to 68 MW by the 18:00 demand peak — the raise signature leads the demand peak by two hours. In summer, raise dispatch holds a plateau of 104–109 MW from 16:00 through 18:00 and does not break until 19:00, tracking the later summer shutdown. The evening raise signature moves with sunset, by the same ninety minutes as the solar shutdown, while the demand peak stays fixed to the clock.
The mirror holds at sunrise. Lower regulation — the downward service — peaks in the morning, and its peak tracks the solar ramp-up rather than the clock: 57.9 MW at 05:30 in summer against 52.6 MW at 07:30 in winter, a two-hour shift that follows the later winter sunrise. The morning demand ramp pushes net load upward and so cannot produce a downward-regulation peak; the morning lower signature is almost purely the solar ramp outrunning demand, and it moves with the sun exactly as the evening raise signature does.
This is the signature the hypothesis predicts, at both edges of the solar day. The seasonal shift does not by itself separate the censored zero-crossing from the ordinary forecast error of a steep solar ramp — both act at the same time and in the same direction. What it does establish is decisive for the attribution: the timing of regulation is set by the solar cycle, not by human demand patterns, and the evening raise signature in particular carries exactly the timing an uncaptured auxiliary step at zero would produce.
Chart: Evening raise regulation tracks the solar shutdown
Telemetry censoring is the best-supported explanation for the residual asymmetry
The natural objection to attributing the asymmetry to censoring is that it should cancel. Regional demand in the NEM is itself derived from unit SCADA, so the censoring enters the calculation twice and with opposite sign. Clipped telemetry overstates semi-scheduled net output by the auxiliary quantity; demand, computed from the same clipped telemetry, overstates regional demand by the same quantity. In steady state the two errors cancel and the auxiliary load is absorbed into TOTALDEMAND.
That cancellation is an accounting identity, not a timing one — and it is timing that governs regulation. Auxiliary load is anti-correlated with generation: it appears as a plant shuts down and disappears as it starts. The censored step therefore enters the demand estimate precisely at the moment the resource fails — the condition most strongly associated with raise deployment — and the dispatch target for the following interval is set without it. The cancellation holds on average and breaks exactly where raise regulation is called.
Three independent lines of evidence now converge. The mechanism has the correct sign — a hidden import appearing at shutdown requires upward correction. It has the correct magnitude — 88 to 147 MW of censored auxiliary load, two to three times the 41.8 MW gap. And it has the timing the hypothesis predicts — the seasonal test above shows the evening raise signature tracking the solar shutdown rather than the demand ramp, and shifting ninety minutes between winter and summer. No other candidate examined here — symmetric procurement, curtailment headroom, or the demand ramp itself — reproduces the gap or matches this signature.
On the balance of the evidence, censored semi-scheduled telemetry is the leading contributor to the raise-over-lower regulation asymmetry. What the public record withholds is not evidence that the effect is real but a direct measurement of its size, because the quantity is removed before publication. Sizing it exactly requires plant-side metering; attributing the asymmetry to it does not.
Conclusion
1. Raise and lower regulation are procured at a ratio of ~1:1 and deployed at a ratio of ~2:1. The mean dispatch gap is 41.8 MW.
2. Demand ramp and semi-scheduled delivery error both predict the direction of dispatch, but neither constitutes an explanation of the asymmetry; both restate the function of the service.
3. The asymmetry is traceable to the shape of the semi-scheduled delivery-error distribution, which is left-skewed by a factor of approximately two in the tails. Semi-scheduled overshoot is only sometimes bounded — by the semi-dispatch cap, and only when that cap binds; undershoot is bounded only by the weather.
4. Curtailment headroom governs that distribution at unit level, and does so decisively: a curtailed unit fails to hold its target sixty times less often than an uncapped unit. The effect attenuates to approximately 1.2 at system level and does not account for the dispatch gap.
5. Semi-scheduled telemetry is censored at zero, hiding an estimated 88 to 147 MW of station auxiliary load — two to three times the dispatch gap. In steady state the demand calculation absorbs it; at the point of resource failure it does not, and that is where raise regulation is called. The mechanism matches the asymmetry in sign, in magnitude, and in timing: the evening raise signature tracks the solar shutdown seasonally, shifting ninety minutes between winter and summer, which rules out the demand ramp as the driver.
6. On the balance of the evidence, censored telemetry is the leading explanation for the raise-over-lower asymmetry: no competing mechanism examined here reproduces its sign, magnitude, and seasonal timing together. The open question is the effect's exact size, not its existence — permitting negative semi-scheduled forecasts and uncensored telemetry would make it directly measurable and settle that last question.
Source: AEMO MMSDM dispatch, unit SCADA and FPP datasets. Mainland NEM (NSW1, QLD1, SA1, VIC1), 5-minute resolution, July 2025 to June 2026. Queried using NEM Explorer.
Correction, 21 August 2026. Sections 3 and 4 originally reported the semi-scheduled delivery-error decomposition and distribution over 1 May to 30 June 2026, while the rest of the report, and its stated window, covered the twelve months from July 2025. Those figures have been recomputed over the full twelve months and now read: shortfall above 150 MW coincides with 147.6 MW raise against 18.4 MW lower (was 134.0 and 17.6); units fall short of target in 55.5% of intervals (was 50.5%); skewness −1.07 (was −1.19); mean −28.1 MW against a median of −10.3 MW (was −14.7 and −0.9); 1st percentile −411 MW and 99th +213 MW (was −340 and +186). The lower tail remains about twice the depth of the upper tail and every conclusion is unchanged. The delivery-error definition itself was correct as published: it compares the telemetered MW at the end of each interval with that interval's dispatch target, which in AEMO's tables means INITIALMW from the following row, because SCADAVALUE(t) and INITIALMW(t) are the same start-of-interval reading.
A follow-up report measures what happens at the moment these units are switched off and back on: Wind and solar restarts, not shutdowns, are what raise regulation pays for.